


Decoupling economic growth from CO2 emissions in the world
The progressive warming of Earth suggests an important danger for future populations. As stabilizing the level of greenhouse gases (GHGs) in the atmosphere becomes inadequate, there is now talk of reducing this level while preserving sustainable economic growth rates. This Policy Brief deals with the issue of the economy’s carbon intensity through a decoupling indicator, defined as the ratio between the change in carbon dioxide (CO2) emissions and Gross Domestic Product (GDP). It also highlights some remarkable trends emerging from the experience of different countries. Globally, CO2 emissions were stable for the third consecutive year despite strong economic growth, which suggests a decline in the carbon intensity of the economy. However, the study of the decoupling indicator has shown that disparities exist between regions. Africa, and Morocco in particular, shows mixed results insofar as there is a low degree of decoupling -or dissociation- between CO2 emissions and GDP.
Introduction
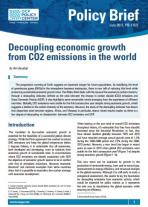
The transition to low-carbon economic growth is essential for the feasibility of a successful global climate strategy. While the Paris agreement has worked to reduce GHG emissions and keep the global temperature below 2 degrees Celsius, it is undeniable that all economies, both developed and developing, want to maintain their economic growth at sustainable rates. In circumstances where CO2 emissions are closely associated with GDP, the objective of economic growth seems to be in conflict with that of emissions reductions. However, economic literature and concrete examples from some countries show that it is possible to reconcile a low-carbon strategy with economic development. When looking at the sum total of overall CO2 emissions throughout history, it’s noticeable that they have steadily increased since the Industrial Revolution. In fact, they have almost doubled globally between 1975 and 2016 and have recorded average annual growth rates of 1.4% during the 1990-2000 period and 2.5% during the 2000-2010 period. However, a new trend has begun in recent years as seen in 2016 when global CO2 emissions were stable for the third consecutive year (Figure 1-a) despite strong economic growth (Figure 1 -b). This new trend can be explained by growth in the production of renewable energy, from coal to natural gas, improvements in energy efficiency, and structural changes in the global economy. Although it is still early to make a categorical assessment, this seems to lay the foundation for decoupling emissions from economic activity, which would be essential for policy makers as it represents the only way to decarbonize the global economy while ensuring its efficiency.
CO2 emissions
Real GDP
Decoupling indicator: a relevant instrument for an ecological transition
The decoupling indicator illustrates the different growth trajectories of environmental and economic variables. Introduced in the 2000s, it is based on the same idea found in the theory of the Environmental Kuznets Curve (EKC). It states that the more a country's wealth increases, the more individuals opt for environmental quality once their basic needs are met. The decoupling indicator thus allows economists and decision-makers to measure the correlation between the economic and environmental spheres and to explain the mechanisms of junction between them. From an empirical point of view, it is defined as the ratio between the variation of environmental variables, such as CO2 emissions and the variation of economic variables, such as real GDP, either in absolute or per capita form. Generally speaking, decoupling is said to occur when the rate of growth of CO2 emissions becomes less rapid than that of GDP over a given period. However, the decoupling indicator is characterized by simplicity, which can sometimes be misleading. Indeed, most pressures on the environment are the result of multiple factors and cannot be understood without complex modeling tools. A misinterpretation could thus lead to an attitude of misguided excess of confidence that would be harmful to the environment.
Mixed results in different regions and countries of the world
The decoupling indicator has been calculated in this section for different regions of the world, using the EDGAR and World Bank databases. The results point to mixed results between OECD and non-OECD regions.
1. Encouraging results for OECD regions
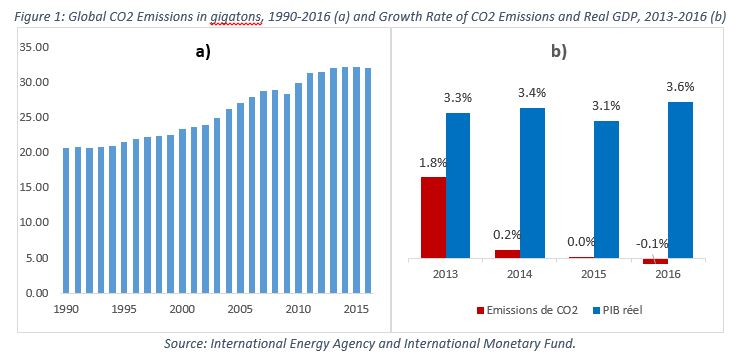
On the basis of this analysis, a strong prevalence for decoupling in OECD countries is deduced (Table 1). The periods of strong decoupling indicate that per capita CO2 emissions have declined despite marked economic growth, indicating dissociation between emissions and GDP.
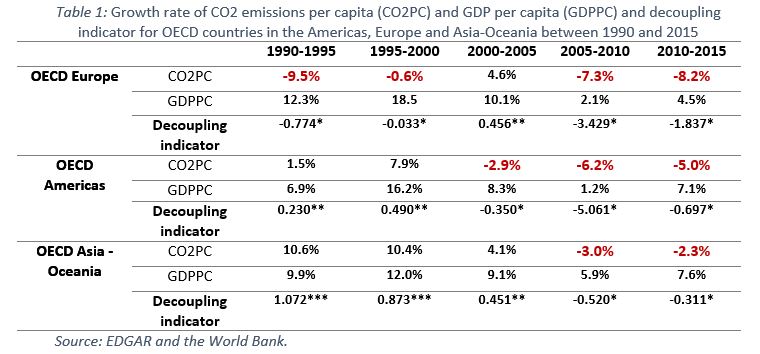
Historically, Europe's OECD countries represent the region with the best decoupling performance. This positive trend is explained by environmental energy policies and by the good performance of countries such as Sweden, which is indeed a reference in terms of decarbonizing the economy. Between 2000 and 2015, Sweden’s total CO2 emissions per capita decreased by 34.4%, while overall GDP per capita grew by about 23.4% (Figure 2). In addition, fossil fuels accounted for 27% of its energy mix in 2015, which is very low in comparison with most OECD countries, while nuclear and renewable energy accounted for 73%.
Sweden's success is mainly based on innovation in clean and environmentally friendly technologies and on pioneering environmental policies. Indeed, carbon pricing, through the imposition of CO2 emissions, has been the main instrument for reducing the consumption of fossil fuels over the last 30 years. The Swedish carbon tax is one of the highest in the world, estimated at $ 126 / tCO2 in 2016. Moreover, due to a low level of fossil fuels in the energy mix, CO2 emissions per unit of GDP have decreased by over 30% since 2000. The intensity of Swedish CO2 emissions - defined as CO2 emissions per dollar of GDP - is thus one of the lowest in the OECD.
Sweden, CO2 per capita, GDP per capita
Canada, CO2 per capita, GDP per capita
Another relevant example is the OECD Americas region, where Canada mainly drives the strong decoupling (Figure 2). CO2 emissions per capita thus achieved negative rates of change estimated at -3.7%, -7.5% and -3.2% during the periods 2000-2005, 2005-2010 and 2010-2015 respectively, while GDP per capita increased by 8.1%, 0.5% and 5.6% over these same periods. Canada's positive climate change outcomes are based on a sector-wide approach to reducing GHG emissions in key sectors of the economy, such as electricity and transport, while continuing to create jobs and stimulate economic growth.
To this end, the Canadian electricity sector is already one of the least polluting of the G7, since 79% of electricity is produced from non-emitting sources -one of which is wind power, which has seen a sharp increase of 20% over the past 5 years. In addition, in 2012, the Canadian government passed legislation prohibiting the construction of new conventional coal-fired power plants. It also introduced a phase-out schedule for existing power plants and adopted natural gas as the standard for new power plants.
Furthermore, the technological and structural changes Canada has experienced have led to increased energy efficiency and the growth of service industries with low CO2 emissions. As a result, emission intensity declined by an average of 1.3% per year between 1990 and 2012 and it is expected that this trend will continue to decline by 2020.
2. Mixed results for Africa, Morocco and China
Africa has mixed results given that low or even recessive decoupling has been observed (Table 3), which is not an ideal scenario for decarbonizing growth but is not a catastrophic scenario neither. As a matter of fact, the evolution of CO2 emissions and GDP per capita shows that their trajectories have indeed separated since 1998. However, 2008 marks a turning point as the evolution of GDP per capita has reversed, while emissions continued to increase until 2014 when they stabilized, except for the slight decrease observed between 2010 and 2011 (Figure 3).
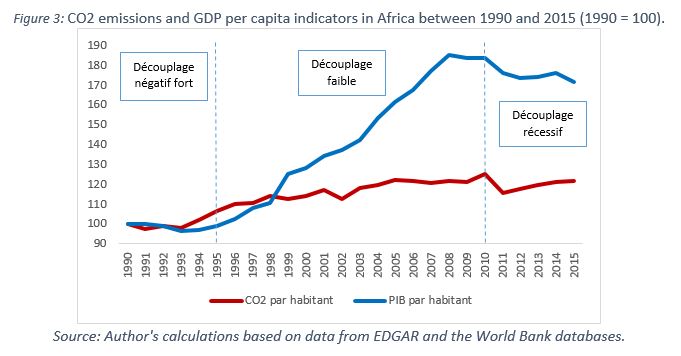
Strong negative decoupling
Weak decoupling
Recessive decoupling
CO2 per capita
GDP per capita
In the case of Morocco, like the rest of the African continent, the results show that decoupling has indeed taken place but is weak. In fact, CO2 emissions per capita continue to grow, but at a slower pace than per capita GDP (Table 3). The Kingdom's total energy consumption continues to be dominated by fossil fuels, notably oil and coal (81% in 2014), followed by natural gas (14.2%) and renewable energy (4.8%).
Therefore, in order to reinforce this decoupling, Morocco has adopted a strategy of resilience to climate change, the aim of which is to ensure a rapid transformation towards a low-carbon and efficient economy. This strategy is based on two main elements. First, Morocco has committed to reducing its GHG emissions by 42% by 2030 compared to the "business as usual" (BAU) scenario. It also advocates strengthening the use of natural gas and renewable energy, in particular for the generation of electricity - the largest polluter sector in the Kingdom - and the diversification of its energy mix in favor of renewables. It thus expects to attain over 50% of installed electrical power from renewable energy by 2030.
Secondly, Morocco plans to achieve energy savings through energy efficiency measures aimed at reducing energy consumption by 15% by 2030 by targeting the industrial, transport and construction sectors. These measures include reducing logistics costs, wise-use of raw materials in the industrial sector, waste recycling and recovery, restructuring the agricultural sector, incorporating the climate change dimension, etc.

Outside the African continent, China is another relevant example. The Chinese economy surged in the early 2000s, leading to increased fossil fuel consumption and therefore large quantities of CO2 emissions, which explains the extensive coupling observed during the 2000-2005 period (Table 3). On the other hand, over the past two decades, China has limited its coal consumption, which declined by almost 4% in 2015. As a result, CO2 emissions per capita fell by 1.1%. Decoupling is therefore still weak.
In addition, since decoupling emissions became a priority, the Chinese government has set up a set of energy and environmental targets through its 13th National Five-Year Plan (2016-2020). China is therefore forecasting a reduction in energy intensity and carbon intensity of around 15% and 18% by 2020 respectively, combined with an increase in economic growth of 6.5% per year (Figure 6). This would enable China to achieve a 48% reduction in emissions between 2005 and 2020.
Furthermore, the decarbonization of the energy mix is becoming increasingly widespread. China accounted for 36% of international investments in renewable energies in 2015. Its five-year plan therefore foresees the continuation of these investments in order to increase the share of non-fossil energies to 15% by 2020 in the energy consumption total compared to 7% in 2000 and 12% in 2016.
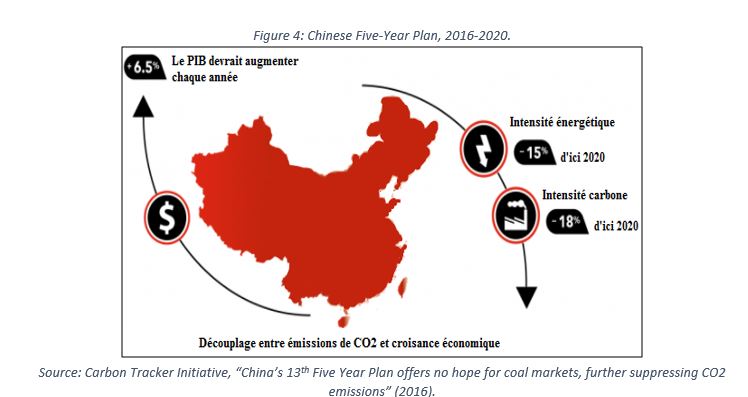
Energy intensity
Carbon intensity
Decoupling of CO2 emissions and economic growth
GDP should increase annually
3. Disturbing results for the Middle East
The Middle East region is showing some disturbing trends, as it shows a coupling during the 2005-2010 period and a recessive decoupling during the 2010-2015 period (Figure 5-b). In addition, indicators for CO2 emissions and GDP per capita are characterized by large fluctuations (Figure 5-a). In 2015, they were at 16 for per capita CO2 emissions and -36 for per capita GDP, indicating that emissions increased while GDP decreased in 2015.
An analysis of this region’s energy profile offers some answers justifying these results. In 2016, energy consumption in the Middle East increased by 2.6%. This region alone consumes 6.7% of the energy on a global scale. Although its consumption has become dominated by natural gas (51.5%), the share of oil remains significant (46.7%). Moreover, the majority of these countries are large producers and exporters of oil. In addition, the share of fossil fuels in primary energy in the Middle East in 2016 accounted for 99.2%. It is the highest in the world and well above the world average of 85.5%. There is no doubt then that the Middle East faces major energy challenges as conventional fossil resources diminish and its population continues to grow.
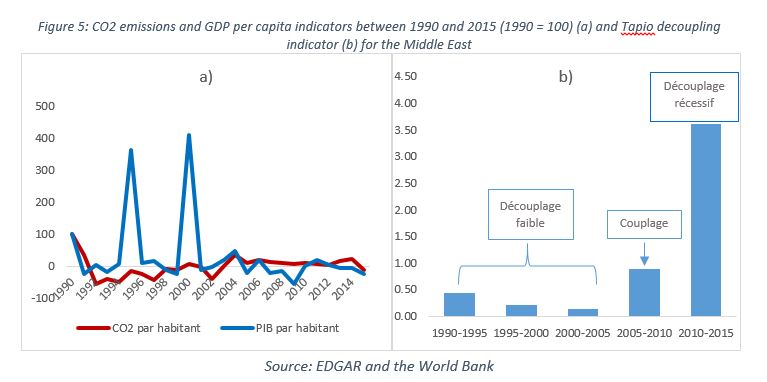
CO2 per capita
GDP per capita
Week decoupling
Coupling
Recessive decoupling
Conclusion
Overall, the main conclusion from this Policy Brief is that reducing CO2 emissions is not necessarily based on a decline in economic growth, but can be achieved by improving energy efficiency and by reducing carbon intensity.
Some recommendations can be formulated to strengthen efforts to decouple CO2 emissions from economic growth, particularly for developing countries. In general, one of the most effective approaches is to provide economic incentives for businesses and households. These can take the form of an emission tax, a ceiling on the total annual emissions level, or a system of tradable emission quotas. It should be noted, however, that these approaches should be adapted to the specificities of each country.
The African continent in particular has vast renewable resources that provide it with great potential for decarbonized sustainable growth. The challenge now lies in strengthening policy and legislative measures in order to consolidate the share of renewable energies in its energy mix, while overcoming the high costs of renewable energies and competition from conventional fossil fuels, which are still present in the continent. The optimal use of its renewable potential will thus bring significant socio-economic benefits to poverty alleviation, economic growth, employment and environmental protection.